
Money Transfers in April
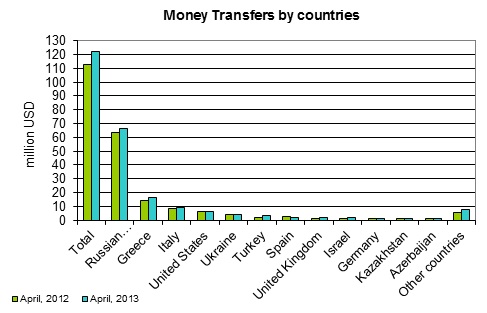
94.0 percent of total money transfers from abroad fall on those 12 big donor countries, from which the volume of such transfers exceeded 1 million USD in April. In April 2012 the share of these 12 countries constituted 95.0 percent of the total volume of money transfers.
|
|
Volume of money transfers in April, 2013 Million US Dollars |
Structure of money transfers by the biggest donor countries % |
|
|
April, 2012 |
April, 2013 |
||
|
Total |
122.4 |
100.0 |
100.0 |
|
Russia |
66.6 |
56.5 |
54.5 |
|
Greece |
16.7 |
12.8 |
13.6 |
|
Italy |
9.0 |
7.5 |
7.3 |
|
USA |
6.4 |
5.8 |
5.2 |
|
Ukraine |
3.9 |
3.5 |
3.2 |
|
Turkey |
3.3 |
1.8 |
2.7 |
|
Spain |
2.0 |
2.1 |
1.6 |
|
United Kingdom |
1.7 |
1.3 |
1.4 |
|
Israel |
1.6 |
1.3 |
1.3 |
|
Germany |
1.5 |
1.0 |
1.2 |
|
Kazakhstan |
1.1 |
0.7 |
0.9 |
|
Azerbaijan |
1.1 |
0.7 |
0.9 |
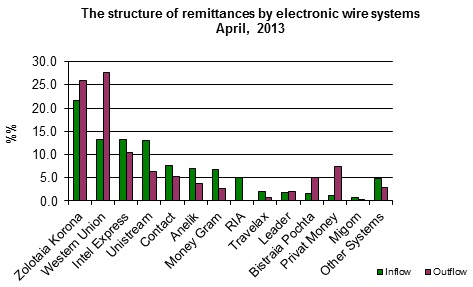
In April 2013, 137 million USD (or 22.7 million GEL) were transferred from Georgia instead of 7.9 million USD (or 12.9 million GEL) in April 2012.
In the reference month, the structure of remittances by electronic wire systems is shown on the graph below.
Present statistical information is published on the web-site of the National Bank of Georgia at the following address: the http://nbg.gov.ge/index.php?m=306&lng=eng